Modeling urban green space to predict flood risk
60% of the world’s population is projected to live in urban areas by 2030, and about 23% will experience flooding worldwide. With these statistics, how can urban planners and local city officials measure their mitigated flood impact by promoting and funding urban green spaces?
Hypothesis:
Areas with more green space will have lower exposure to flooding.
Data:
OECD City Statistics focusing on Functional Urban Areas (FUAs)
Variables:
Flood risk, population, green space per capita, GDP per capita, air quality
Tools:
R Studio and Microsoft Excel
Building the Model:
Download the datasets and merge them using R Studio
Clean the datasets using only the necessary variables
Develop a logistic regression model using the threshold of 23% exposure as a baseline for above-average exposure to flooding. We aimed for our model to use variables that urban planners could easily access to measure flood impact mitigation. For our most parsimonious model, we ended up using the following variables:
Population
Green space per square meter per capita
GDP per capita
Average building height in meters
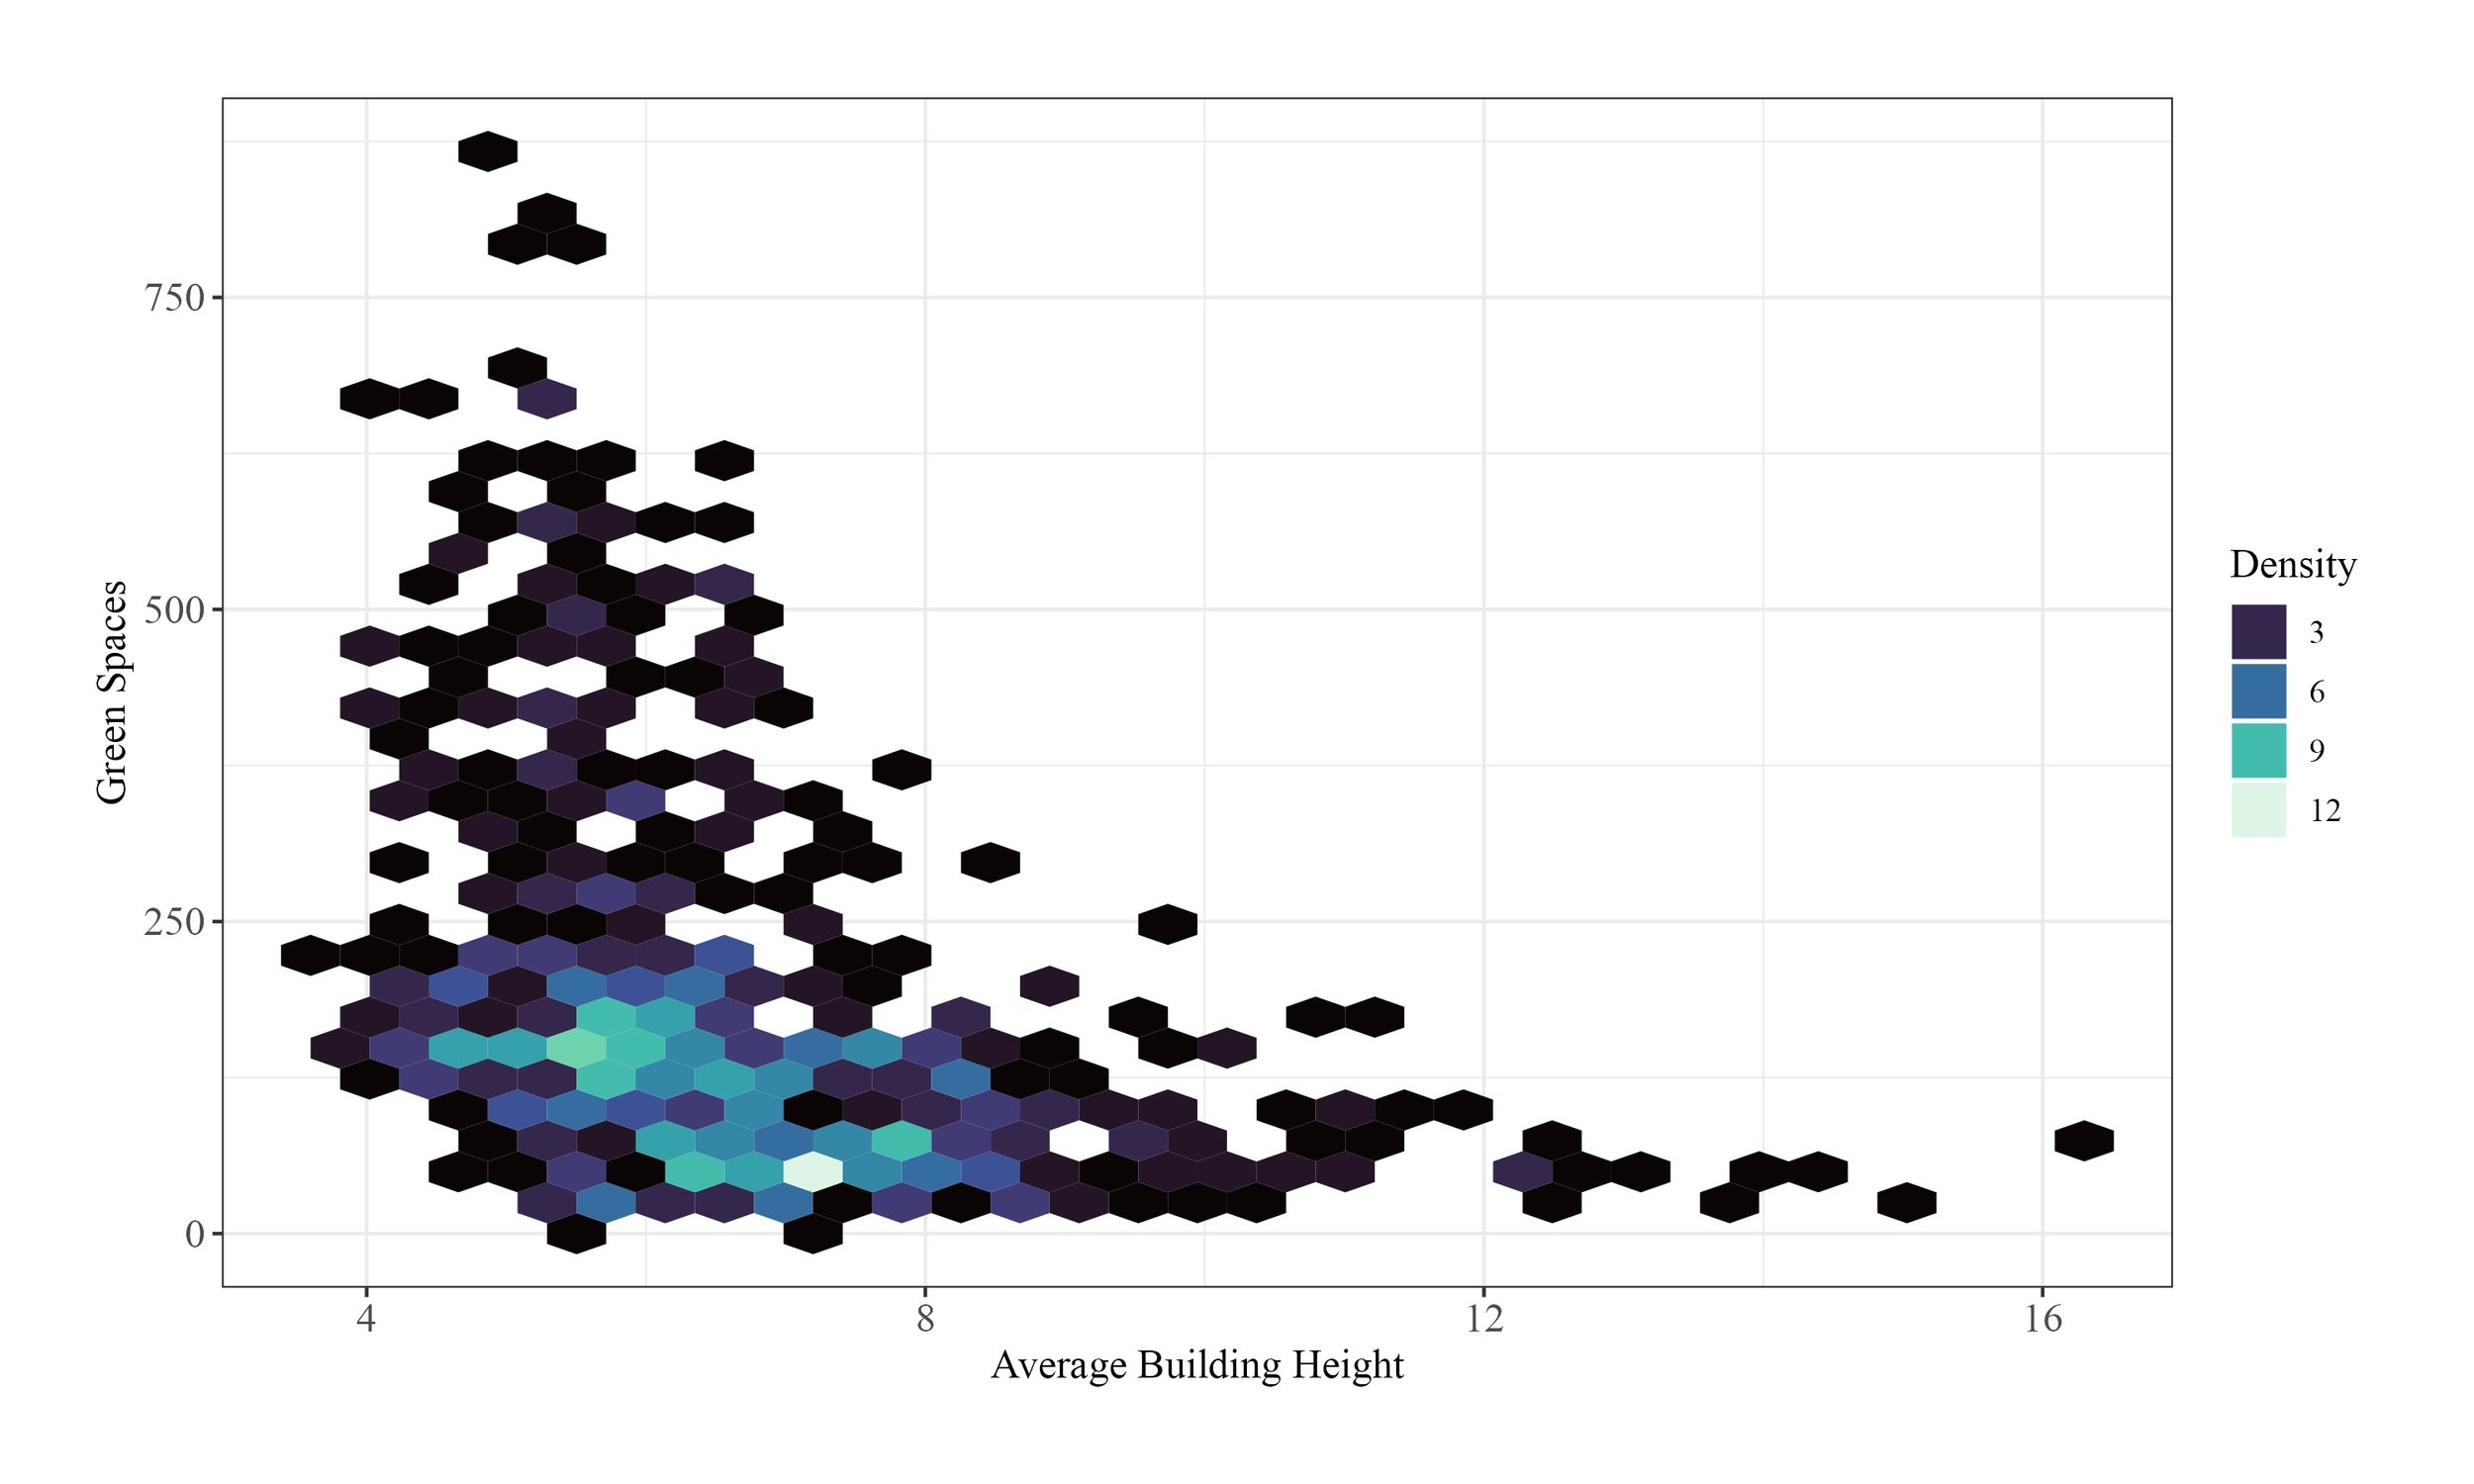
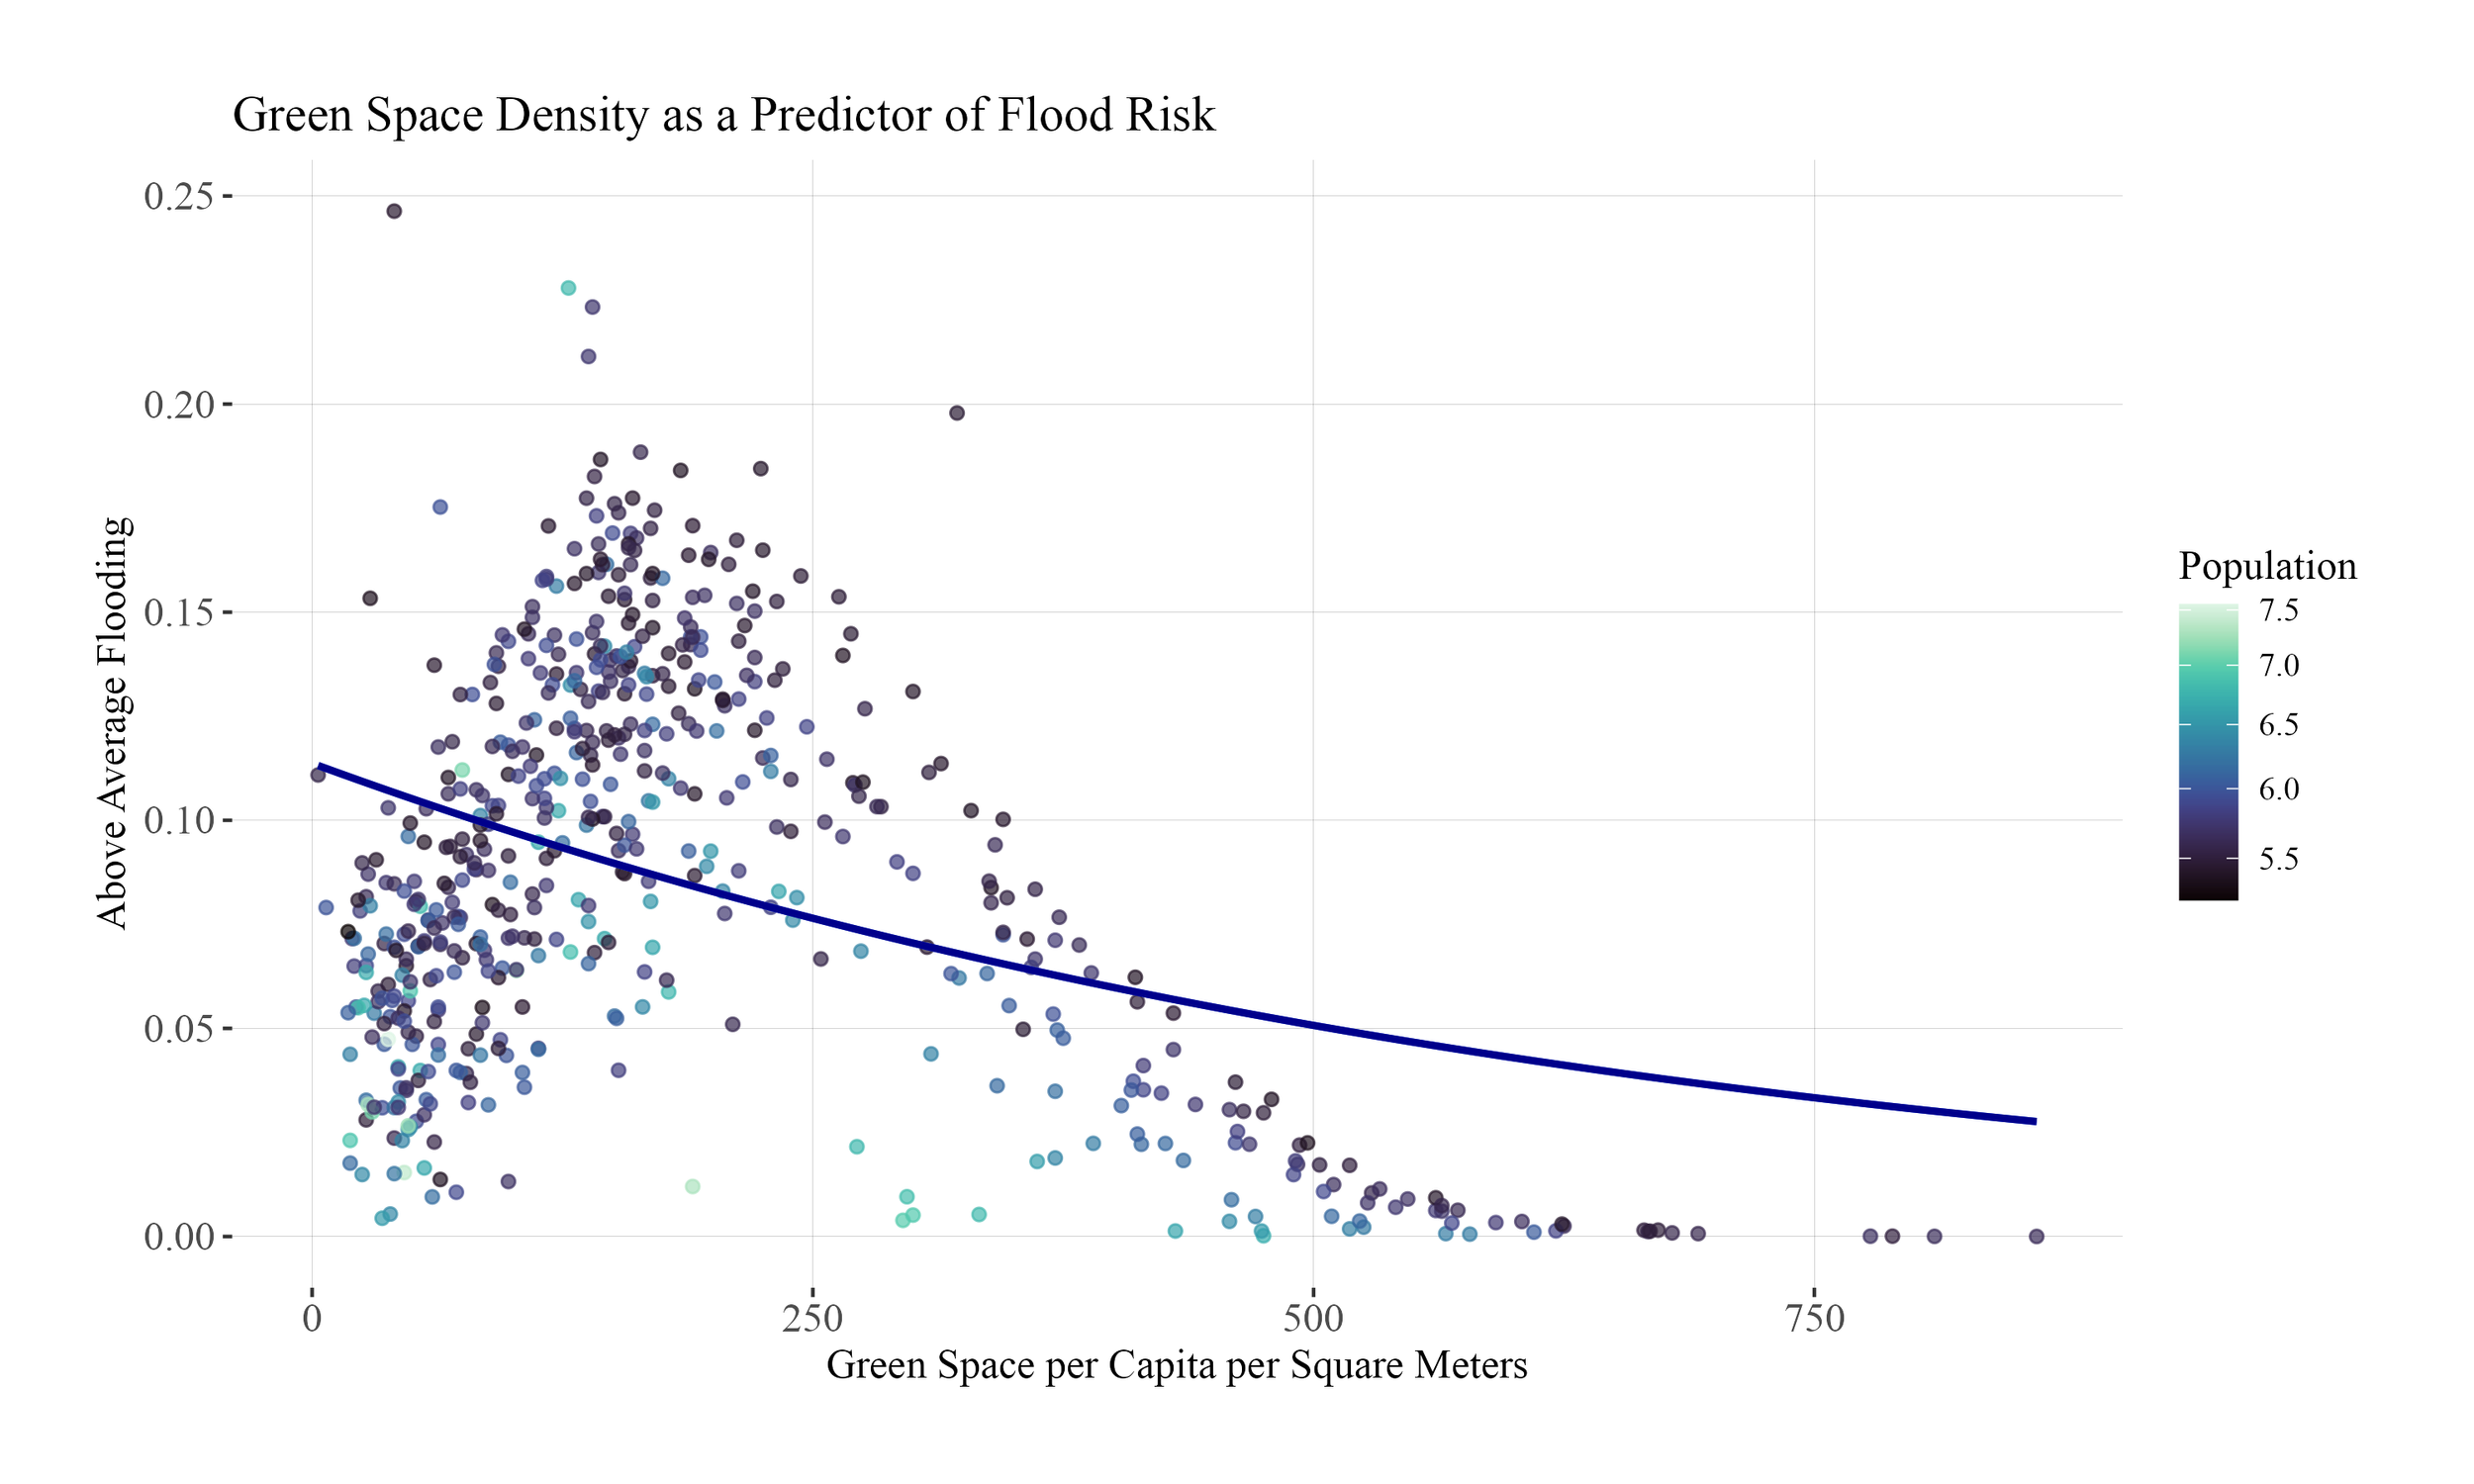
Visualize our findings in R Studio using a hexbin, map, and scatterplot with a trendline.
Data Visualizations
Conclusions
As predicted, there is a negative correlation between green space and flood risk.
Green space projects should be prioritized in locations with lower building heights to maximize the potential for photosynthesis.
When selecting green space projects, urban planners must also account for the area's population density, as human activity can degrade plant biomass.
Further Inclusions and Limitations:
The model could be improved by including other environmental factors such as average rainfall and average city temperature.
The model is largely represented by OECD member countries. The populations which are impacted the most heavily by flooding in urban areas are located in southeast Asia, so for a better global model, data from that region would also improve the predictive model.


